The Core Types of Insider Risk Metrics
A practical way to organize the measurements that help organizations understand exposure, concentration, change, coverage, effectiveness, and outcomes.
“A mature insider risk program does not need more disconnected numbers. It needs a way to organize the right numbers around the decisions leaders actually have to make.”
In the first post in this series, I argued that insider risk needs a common metrics language. Without it, programs struggle to describe exposure, compare parts of the business, prioritize action, or prove that posture is improving. In the second post, I focused on the qualities that make a metric useful: measurable, repeatable, decision-useful, and comparable over time.
But even good metrics can become noise if they are not organized. That is the next challenge for insider risk.
Most programs can point to individual measures: alerts, cases, policy exceptions, training completion, access review status, time-to-close, or control deployment. Some are operationally necessary. Some are strong indicators. Others are weak proxies. But none of them, by themselves, gives leaders a complete view of insider risk.
The problem is not only that programs need better metrics. They need different types of metrics for different decisions.
This distinction matters because insider risk is not one question. It is a set of related questions:
A single number cannot answer all of that. A long dashboard of raw counts cannot answer it either.
A more practical approach is to organize insider risk measurement into core metric families. Each family answers a different question. Together, they give leaders a more complete way to understand posture, prioritize action, and track progress over time.
At a high level, every serious insider risk program should understand six types of metrics:
- Exposure metrics.
- Concentration metrics.
- Trend and velocity metrics.
- Coverage and confidence metrics.
- Control effectiveness metrics.
- Outcome metrics.
These are not meant to be six disconnected dashboards. They are a way to structure the measurement system so that every number has a job.
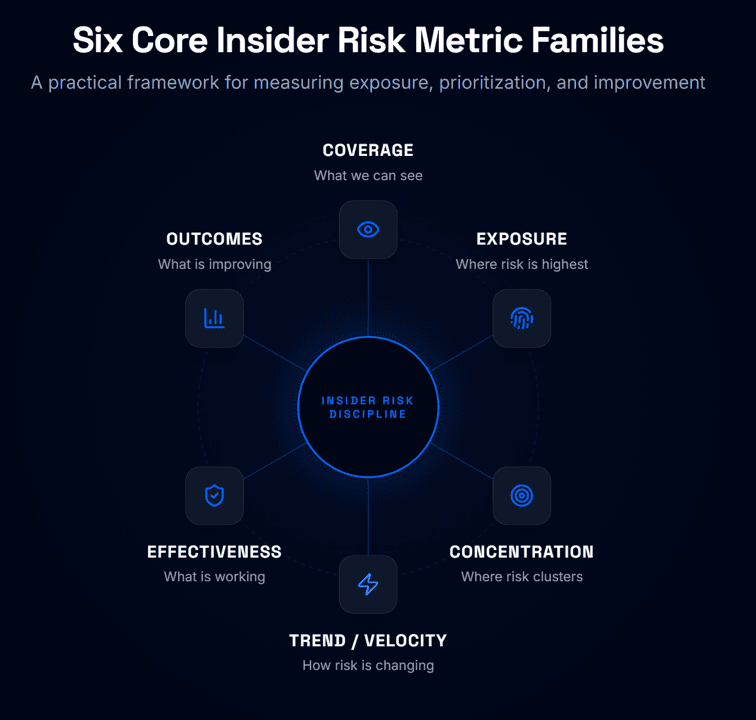
Figure 2: The Core Types of Insider Risk Metrics — mapping exposure, concentration, trend, coverage, effectiveness, and outcomes.
1Exposure metrics
Where are we meaningfully vulnerable right now?
This is different from asking where incidents have already occurred. Incidents tell you what surfaced. Exposure metrics help you understand where conditions exist for material insider risk to occur, whether or not an incident has already been confirmed.
That distinction is important. A team may have no recent cases, but still have broad access to sensitive data, weak controls, limited monitoring, stale access reviews, and poor evidence that activity would be detected quickly. Another team may produce more alerts, but also have stronger coverage, cleaner access governance, and better containment. Raw activity would point one way. Exposure may point another.
A useful exposure metric should bring together the factors that shape present vulnerability: potential impact, current weaknesses, access reach, control gaps, relevant signals, and containment bounds. It shifts insider risk from an after-the-fact reporting discipline to a current-state management discipline, enabling proactive prioritization.
2Concentration metrics
Where is insider risk clustered?
Insider risk is rarely distributed evenly. Some cohorts have greater access. Some roles can move more sensitive data. Some business units work with higher-value information. Some teams depend on more external collaboration. Some assets are more concentrated points of consequence. Vendors, administrators, executives, finance, developers, or deal teams hold greater capability to cause material harm.
A measurement model that treats the enterprise as flat will miss that reality. Concentration metrics render the uneven distribution of risk visible, displaying whether exposure is spread broadly across many areas or concentrated in a smaller number of cohorts, assets, systems, locations, roles, or processes.
This alters the defensive action. If exposure is broad, baseline enterprise-wide control improvement is appropriate. If exposure is concentrated, targeted access reviews, tighter controls, specialized awareness, or focused remediation are far more efficient. It stops teams from chasing raw volume instead of consequence.
3Trend and velocity metrics
How is insider risk changing?
A static snapshot is useful, but it is not enough. An exposure score, coverage measure, or control effectiveness indicator means much more when leaders can see whether it is improving, deteriorating, accelerating, or staying flat.
Trend metrics describe direction. Velocity metrics describe speed. That difference matters. Two areas may have the same current exposure, but one was stable for six months while the other increased sharply in the last thirty days. Those are completely different management problems.
Bending the curve is what executive leadership values. Trends and velocity prevent overreacting to minor noise, allowing teams to separate routine variations from major shifts in visibility or defensive posture.
4Coverage and confidence metrics
How much should we trust what we think we know?
This is one of the most overlooked parts of insider risk measurement. A program cannot responsibly claim that risk is low if it cannot see enough to support that conclusion. Limited visibility does not mean low risk—it means uncertainty. If a sensitive collaboration platform is not covered, logging is inconsistent, or access data is stale, you are measuring only part of the picture.
Coverage metrics describe what you can see. Confidence metrics describe how defensible the measurement is.
A high-exposure area with high confidence is immediate triage action. A high-exposure area with low confidence is a visibility problem—you must improve telemetry, update logs, or close data gaps before attempting to define the correct intervention. It keeps the measurement system honest and guards against false precision.
5Control effectiveness metrics
Are the things we are doing actually reducing risk?
This is different from asking whether work has been completed. Many programs can report completion: a policy was published, a tool was deployed, training assigned, or an access review performed. Those are facts, but they do not prove effectiveness.
Completion tells you whether an activity happened. Effectiveness tells you whether the activity changed posture.
High completion with high exposure exposes major mismatches—you may be doing work, but not solving the risk. Low completion with high exposure points directly to priority gaps. Good control effectiveness metrics connect action directly to exposure reduction, resolving "checklist confidence" and securing budget alignment.
6Outcome metrics
What changed as a result of the program?
This is where insider risk measurement connects to governance, business decisions, and executive confidence. Outcome metrics should not be limited to incident counts, which are lagging and incomplete.
A mature program must display broader outcomes: exposure reduction, improved coverage, stronger confidence, better control performance, reduced concentration, faster remediation, and closer alignment with risk appetite.
These metrics are the bridge between operational tasks and executive relevance. They allow programs to show progress even when success is not captured by simple incident counts. They help demonstrate that because of a set of strategic investments, serious risk was contained before it could materialize.
How the metric families work together
These six metric families are most useful when they are connected:
Exposure tells you where you are meaningfully vulnerable. Concentration tells you where that vulnerability is clustered. Trend and velocity tell you whether the situation is improving or deteriorating. Coverage and confidence tell you how much to trust the measurement. Control effectiveness tells you whether interventions are working. Outcome metrics tell you whether the program is producing measurable improvement.
Together, they create a more complete measurement model.
They connect directly to the framework from our first post. Visibility and confidence are addressed by coverage and confidence metrics; exposure is addressed by exposure metrics; cohort risk is addressed by concentration; prioritization is supported by exposure, concentration, and control effectiveness; and improvement over time is supported by trend, velocity, and outcome metrics.
Why metric families matter
Imagine two parts of the same organization:
The first (Large Operations Function): Comprises several thousand users. It generates the highest number of alerts in a quarter. On a standard raw dashboard, it draws the most immediate focus.
The second (Small Product Strategy Group): Comprises fewer than fifty users. It generates far fewer alerts, barely standing out.
But the metric families tell a different story: Operation has high activity, but broad coverage, narrow access, mature controls, and a stable trend (moderate exposure).
The product strategy group, on the other hand, works with highly sensitive roadmap and deal-related data, frequently collaborates with external contacts, has unresolved access exceptions, and utilizes platforms where monitoring coverage is incomplete.
Its incident count is lower, but its actual exposure is much higher, risk is heavily concentrated, visibility is weaker, and the trend is moving in the wrong direction.
By examining the metric families rather than raw counts, the decision changes completely. The small strategy group receives the rapid attention it deserves, preventing a major exposure before a leak occurs.
Common mistakes in organizing insider risk metrics
- Trying to make one metric answer every question.Exposure, concentration, velocity, coverage, and control effectiveness are not the same thing. Collapsing them into a single score makes data harder to interpret and act upon.
- Treating incident counts as outcome metrics without context.A decline in cases is a warning sign if monitoring or logging coverage degraded. Outcome metrics require clear visibility and exposure denominators to ensure trust.
- Separating metrics from decisions.A metric must trigger an action. If concentration doesn't direct controls, or coverage doesn't guide telemetry investments, it becomes dashboard clutter.
- Comparing groups without normalization.Populations with completely different access scopes and sizes cannot be compared raw. Large units always look worse, while small, critical strategy cohorts seem falsely safe.
- Reporting confidence only when someone asks.Confidence should sit proactively next to the metric itself. Executives must immediately see whether data is based on strong telemetry or is merely directionally useful.
- Confusing completion with effectiveness.Training modules completed or tools rolled out are completion indicators. Posture shifts represent true, verified effectiveness. Measurement must make that distinction visible.
Why this is hard in practice
The concept is straightforward: organize metrics by the questions they answer. The implementation is harder.
Real-world data is fragmented across systems, platforms, and teams. Access permissions are messy. HR context lag organizational change. Different cohorts are not directly comparable. This is why insider risk measurement requires more than a basic dashboard.
It requires definitions, normalization, repeatable computation, and disciplined interpretation. It requires a way to connect operational signals to strategic governance questions without pretending that every single metric has the same level of confidence.
Executives need the "what" and "why" to govern; operators need the specific drivers to act. The balance between those needs is where insider risk metrics become a real management discipline.
The stages of maturity:
The first stage of maturity is having numbers. The next stage is having useful metrics. The highest stage is having an organized measurement system.
With a structured system, reporting ceases to be a collection of isolated signals and becomes a way to govern the program. Insider risk can establish true, defensive prevention:
The next generation of insider risk programs will not be defined by the number of dashboards they produce. They will be defined by whether their metrics help the organization make better decisions. They give the program a way to move from disconnected reporting to a connected, defensible model.
In our next post, we will turn to the metric family that sits at the absolute center of this model: exposure, and why it is the metric most programs are currently missing.